

Deprecated: mb_convert_encoding(): Handling HTML entities via mbstring is deprecated; use htmlspecialchars, htmlentities, or mb_encode_numericentity/mb_decode_numericentity instead in /var/www/nairametrics/wp-content/themes/nairametrics/functions.php on line 104
No one decides what oil costs.
No committee votes on the price of Bitcoin.
No central office calculates how much a software engineer should earn in Mumbai versus London.
Yet prices for all of these things exist, update continuously, and coordinate the decisions of millions of people who have never met and know nothing about each other. This is what price signals in markets actually accomplish: they aggregate distributed information and transmit it instantly to everyone who needs it, in a form compact enough to act on.
Also Read
What a Price Signal Contains
A single futures price for wheat on the Chicago exchange communicates more information than any analyst report. It encodes current supply conditions, drought forecasts, shipping costs, storage costs, planting intentions in major producing countries, and the collective probabilistic assessment of professional traders about whether supply will meet demand over the coming months.
No central planner could gather and process this distributed information as efficiently. The market does it automatically, through the mechanism of price.
Friedrich Hayek articulated this precisely in his 1945 paper “The Use of Knowledge in Society.” His argument was that the knowledge required to coordinate economic activity is dispersed across millions of individuals – no single mind possesses it all.
A mine operator in Chile knows things about copper extraction costs that no economist in Washington does. A farmer in Punjab knows things about soil conditions that no futures trader in Chicago does. Prices aggregate this local, specific, often tacit knowledge into a single number that anyone can use.
A rising price tells producers: expand supply, this is where resources are needed. It tells consumers: economise, find substitutes, this good is scarcer than it was.
Neither group needs to know why the price rose – the signal is sufficient for action. This is the elegant efficiency of the price system: it transmits the information required to coordinate behaviour without requiring anyone to understand the full picture.
The Five Types of Price Signals That Matter for Traders
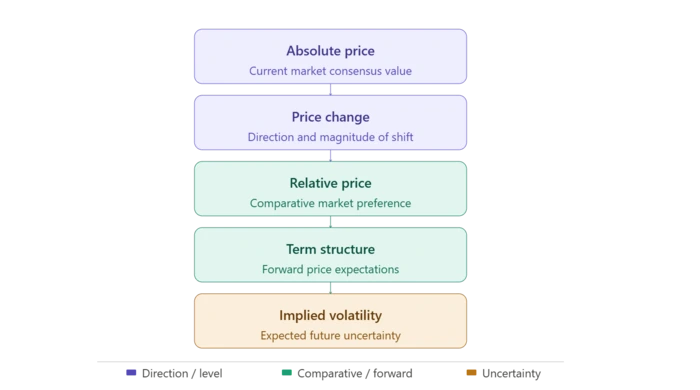
Price signals come in several distinct forms, each carrying different information about market conditions.
The absolute price level is the most obvious: Bitcoin at $65,000 versus $30,000 communicates different things about the market’s current assessment of its value. But the level alone is the least informative of the signal types.
Price change – direction and magnitude – tells you more. A 5% move in Bitcoin on the day of a regulatory approval announcement is a different signal from the same 5% move on a quiet Sunday with no news and below-average volume.
The first reflects genuine new information entering the market. The second is more likely noise – random order flow that may partially reverse.
Relative price, the ratio between two assets, is analytically rich in a way that absolute levels are not. The ETH/BTC ratio signals the market’s comparative view of Ethereum’s utility narrative versus Bitcoin’s monetary premium.
When the ratio rises, participants are pricing in greater expected value for Ethereum’s ecosystem growth. When it falls, Bitcoin’s store-of-value case is reasserting itself. This relative signal tells you something about the market’s internal dynamics that neither asset’s price alone reveals.
The term structure of futures – whether futures trade at a premium or discount to spot – is a forward-looking signal. Bitcoin futures consistently trading above spot (contango) signals that the market expects higher future prices and that holders can earn a yield by selling futures while holding spot. Backwardation – spot above futures – signals near-term supply stress or strong immediate demand.
The shape of the futures curve encodes collective expectations about the next several months in a form that a single spot price cannot.
Options implied volatility is the fifth type: a signal about expected future price variability rather than direction. When implied volatility spikes ahead of scheduled events – Federal Reserve decisions, ETF approval dates, protocol upgrades – the market is signalling collective recognition that the event could produce significant movement in either direction. A trader who ignores IV is missing information about risk that other participants have already priced in.
| Signal type | What it encodes | Practical example |
| Absolute price | Current consensus value | BTC at $65,000 |
| Price change | Shift in supply-demand balance | 5% rally on ETF approval news |
| Relative price | Comparative market preference | ETH/BTC ratio rising |
| Term structure | Forward expectations | BTC futures in contango |
| Implied volatility | Expected future uncertainty | IV spike before Fed decision |
When Price Signals Carry Extra Information in Crypto
Crypto markets produce a layer of verifiable data that traditional markets cannot: on-chain information. Because blockchain transactions are publicly visible, price movements can be cross-referenced against observable network behaviour in real time.
A Bitcoin price rise accompanied by declining exchange inflows – holders moving BTC to cold storage, off exchanges – signals accumulation by long-term holders who intend to hold, not sell.
That is a structurally different signal from the same price rise with increasing exchange inflows, which suggests tokens are moving into position to be sold. The price move alone looks identical. The on-chain context is what distinguishes them.
Miner behaviour adds another layer. When miners stop sending coins to exchanges – even as prices fall – it signals conviction that current prices are below their threshold for selling. When miners accelerate exchange deposits, they may be signalling that they expect prices to fall and are liquidating production. Neither signal is infallible, but both add resolution to the raw price data.
When Prices Send Distorted Signals
The price system is not perfect. Prices distort in two conditions: when markets are illiquid and manipulable, and when collective behaviour drives assets far from fundamental value in either direction.
Bitcoin at $69,000 in November 2021 sent clear expansion signals to the mining industry: this price justifies massive investment in ASIC hardware and data center capacity. Miners responded rationally to the signal – and then the signal proved to have been inflated.
Prices fell to $16,000 over the following year. Billions in mining equipment, bought at cycle highs on the basis of a price signal that reflected speculative excess rather than durable demand, became unprofitable. The price system coordinates behaviour efficiently when prices reflect fundamentals; when they do not, they misallocate capital at scale.
This is why cycle context matters as much as price level when interpreting signals. A price rising while funding rates on perpetual swaps exceed 0.1% per 8-hour period is a different signal from the same price rising with flat or negative funding.
The former suggests crowded long positioning at elevated leverage – a signal associated with unsustainable runs that eventually reverse. The latter suggests organic demand without the overhang of forced selling risk.
Reading Price Signals Correctly
The practical skill is distinguishing genuine signals from noise. Three filters help.
Volume confirms or contradicts direction. A price move on high volume relative to the rolling average has institutional backing behind it.
The same move on thin volume is more likely a temporary imbalance that reverts. Bitcoin’s 5% move on above-average volume following an ETF announcement is a genuine signal. A 5% move at 3 AM on below-average volume on a Sunday is not.
Timeframe determines which signal is relevant. A short-term price signal may be bearish – a large holder is exiting – while the longer-term signal remains bullish as institutional accumulation continues at lower prices. Weighting signals by the trading horizon prevents short-term noise from contaminating longer-term positioning.
Cross-asset confirmation adds robustness. When Bitcoin rises while gold falls, the signal suggests genuine risk-on appetite rather than flight to safety driving both up. When Bitcoin and gold rise together, the signal may reflect dollar weakness or broader uncertainty rather than crypto-specific demand. A price signal read in isolation is less reliable than one confirmed by related markets.
Conclusion
Price signals are the mechanism through which markets solve a coordination problem that no central planner can: how to aggregate the dispersed, local, specific knowledge of millions of participants and transmit it in actionable form to everyone who needs it.
For traders, the signal is always present – the challenge is reading it correctly, distinguishing genuine information from noise, and understanding what the price is actually communicating about supply, demand, and expectations. A number on a screen is never just a number.



Warning: Undefined variable $post_id in /var/www/nairametrics/wp-content/themes/nairametrics/comments.php on line 134
Warning: Undefined variable $post_id in /var/www/nairametrics/wp-content/themes/nairametrics/comments.php on line 134