

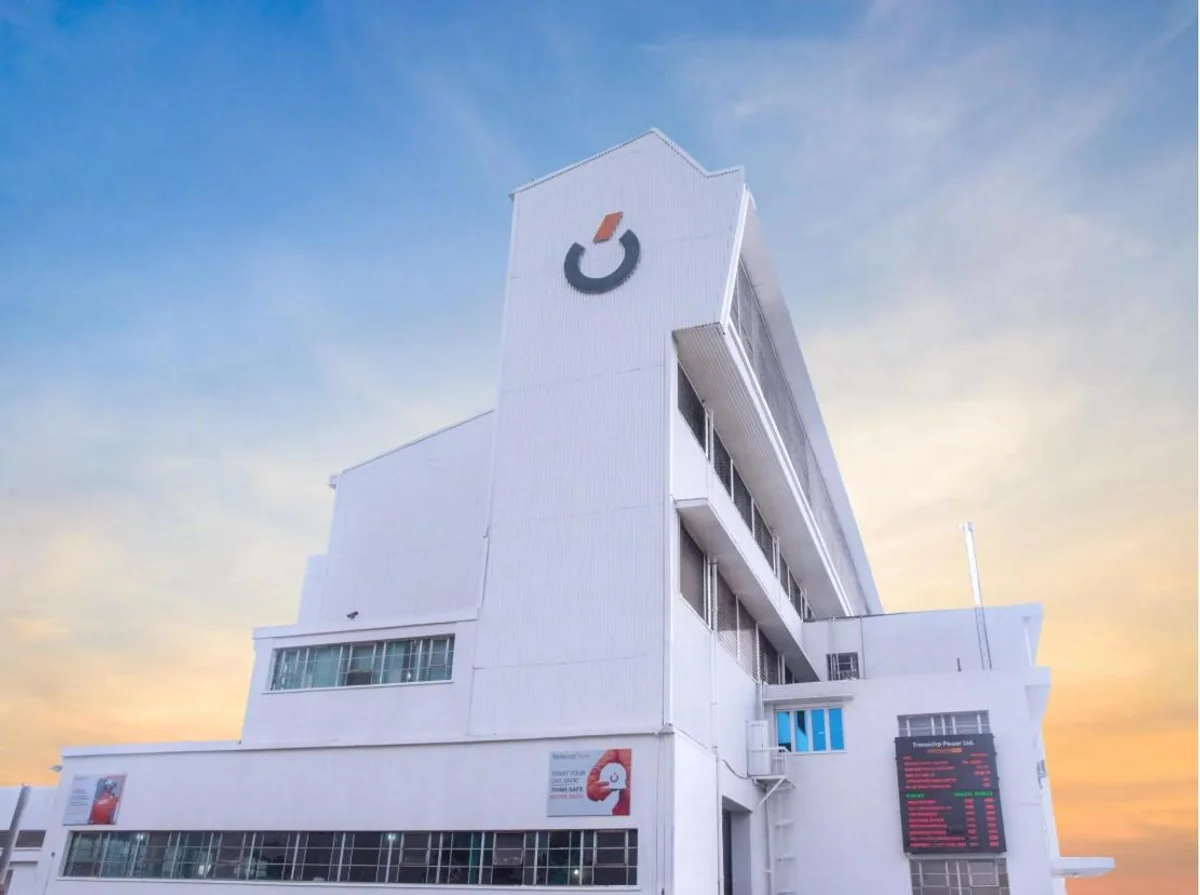
Transnational Corporation Plc (Transcorp) has released its H1 2026 results for the period ended June 30, 2026, reporting a pretax profit of N75.9 billion, representing an 11.45% year-on-year decline from N85.7 billion in H1 2025.
The decline in H1 pretax profit was driven in part by a weaker second-quarter performance.
Q2 pretax profit fell to N25.2 billion from N36.3 billion in Q2 2025, down 30.51% year-on-year, and came in sharply below Q1 2026 levels.
Profit attributable to owners of the parent settled at N32.9 billion, down 20.72% from N41.4 billion, while basic earnings per share fell to 323 kobo from 408 kobo, down 20.83% year-on-year.
Also Read
Interestingly, the Company-only results (Transcorp Plc as a standalone entity, excluding subsidiaries such as Transcorp Power and Transcorp Hotels) told a different story, with profit before tax virtually unchanged at N30.14 billion, up a marginal 0.06% from N30.12 billion, supported largely by higher dividend income from subsidiaries.
Highlights of the Group’s performance (H1 2026 vs H1 2025)
- Revenue: N241.5 billion (Down 13.44% YoY from N279.0 billion)
- Gross profit: N109.7 billion (Down 15.76% YoY from N130.3 billion)
- Operating profit: N81.6 billion (Down 11.34% YoY from N92.0 billion)
- Pretax profit: N75.9 billion (Down 11.45% YoY from N85.7 billion)
- Profit after tax: N54.4 billion (Down 16.58% YoY from N65.2 billion)
- Basic earnings per share: 323 kobo (Down 20.83% YoY from 408 kobo)
- Total assets: N1.10 trillion (Up 9.70% from N1.00 trillion at December 2025)
- Cash and cash equivalents: N20.8 billion (Down 5.13% from N21.9 billion)
Key highlights of Company-only Performance (H1 2026 vs H1 2025)
- Revenue: N37.55 billion (Up 4.81% YoY from N35.82 billion)
- Operating profit: N32.69 billion (Down 1.38% YoY from N33.15 billion)
- Profit before tax: N30.14 billion (Up 0.06% YoY from N30.12 billion)
- Profit after tax: N28.27 billion (Up 1.61% YoY from N27.82 billion)
- Earnings per share: 278 kobo (Up 1.46% YoY from 274 kobo)
- Total comprehensive income: N25.23 billion (Down 11.60% YoY from N28.53 billion)
Driving the numbers:
The pressure on the Group’s topline was broad-based across segments in H1 2026.
- Revenue declined to N241.5 billion from N279.0 billion, while cost of sales eased to N131.8 billion from N148.8 billion, but not enough to fully offset the revenue decline.
- Gross profit fell 15.76% to N109.7 billion, with gross margin slipping to 45.44% from 46.69%.
- Other income fell sharply to N657.7 million from N1.88 billion, down 64.97%, removing a support line that had boosted the prior-year result.
- The Group recorded a N1.96 billion impairment credit/write-back on financial assets, a reversal from the N4.86 billion impairment loss booked in H1 2025.
- Administrative expenses declined 12.75% to N30.8 billion from N35.3 billion, helping contain the decline in operating profit to 11.34%, compared with the steeper 13.44% drop in revenue.
- Finance income nearly halved, falling 58.77% to N2.1 billion from N5.1 billion, while finance costs also declined 54.73% to N6.4 billion from N14.2 billion.
However, the Group swung from a N2.77 billion foreign exchange gain in H1 2025 to a N1.36 billion FX loss in H1 2026, an adverse swing of about N4.13 billion.
- Taxation rose 4.83% to N21.5 billion despite lower pretax profit, pushing the effective tax rate higher and worsening the decline in profit after tax.
- Total comprehensive income fell 26.65% to N48.3 billion, further weighed down by a N6.02 billion fair-value loss on equity instruments recorded under other comprehensive income.
Quarter-on-quarter, Q2 2026 was notably weaker than Q2 2025. Revenue fell 14.40% to N116.4 billion, gross profit dropped more sharply by 32.03% to N39.2 billion, operating profit declined 16.74% to N31.4 billion, and profit after tax dropped 42.08% to N16.5 billion, indicating the second quarter bore the brunt of the half year’s pressure points.
Segment performance:
- Power remained the Group’s biggest revenue driver.
- The segment revenue edged lower to N229.0 billion, down from N243.1 billion.
- As a result, the segment’s pretax profit declined to N57.7 billion from N61.7 billion.
- Hospitality revenue eased to N44.4 billion from N46.9 billion, though its segment pretax profit improved to N13.7 billion from N12.2 billion.
The corporate centre posted revenue of N37.5 billion, up from N35.8 billion, with pretax profit broadly flat at about N30.1 billion.
Balance sheet:
The balance sheet expanded during the period, but this was accompanied by a significant build-up in receivables and borrowings.
- Total assets rose 9.70% to N1.10 trillion, though trade and other receivables alone stood at N636.6 billion, up 17.43%, representing a large portion of the increase.
- Total borrowings rose 54.59% to N116.7 billion, with long-term borrowings surging 203.05% to N106.6 billion, while net debt climbed to roughly N95.9 billion from N53.6 billion.
- Total equity rose 4.09% to N367.8 billion, supported by retained earnings of N197.8 billion, up 9.16%.
- Net cash flow from operating activities remained negative at N13.35 billion, though this improved from a negative N22.57 billion in H1 2025.
- Investing activities recorded a net cash outflow of N3.56 billion, mainly reflecting capital expenditure.
The major pressure points were lower revenue, weaker gross profit, lower finance income, an FX loss, higher taxes, negative operating cash flow, and rising borrowings. The balance sheet is larger, but much of the growth is tied up in receivables rather than cash.
Market reaction:
Shares of Transcorp closed lower on Wednesday, July 22, 2026, at N41.40, down 0.4% from N41.55 previously.
- The stock began the year at N45.40 and hit a high of N55.00 in February.
- It later moderated sharply, leaving it down 8.81% from its year-opening price.
- It ranks 112th on the NGX by year-to-date performance.
Transcorp is the 56th most traded stock on the Exchange over the past three months (April 21–July 22, 2026), with a total volume of 154 million shares traded across 23,128 deals worth N6.69 billion, averaging 2.44 million shares per session valued at N106 million.



Warning: Undefined variable $post_id in /var/www/nairametrics/wp-content/themes/nairametrics/comments.php on line 134
Warning: Undefined variable $post_id in /var/www/nairametrics/wp-content/themes/nairametrics/comments.php on line 134