
 Follow Us on Google Discover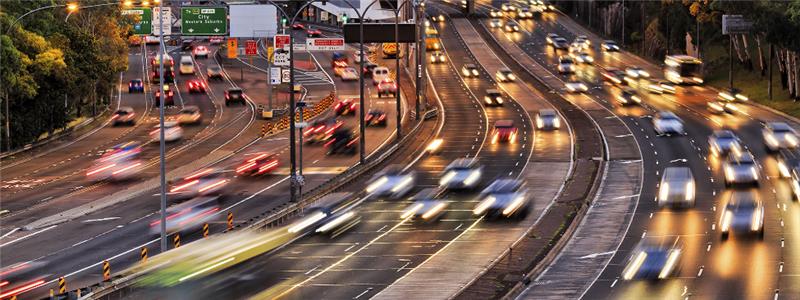
Deprecated: mb_convert_encoding(): Handling HTML entities via mbstring is deprecated; use htmlspecialchars, htmlentities, or mb_encode_numericentity/mb_decode_numericentity instead in /var/www/nairametrics/wp-content/themes/nairametrics/functions.php on line 104
Anyone who loves the vibrancy of outdoor life or the thrill of a road trip knows the heartbreak of being trapped in gridlock or worse, showing up late to an important event because of it.
Yet in many of the world’s most populous nations, what was once an occasional frustration has become the norm.
The daily commute is stretching longer and longer, and traffic has emerged as one of the most visible strains on modern urban life.
The latest figures from Numbeo’s 2025 Traffic Index highlight which also facilitates quality of life, show just how severe the issue has become.
Other News
The index, which blends commute times, wasted hours in congestion, inefficiency, and transport-related carbon emissions, paints a stark picture of countries where the cost of getting from point A to point B is at its highest. More than just an inconvenience, gridlock drains productivity, diminishes quality of life, and adds to already dangerous levels of pollution.
This report explores the top 10 countries with the highest Traffic Index in 2025, offering insight into the scale of the challenge and the patterns that unite the world’s most gridlocked nations.
Colombia
- Traffic Index: 198.0
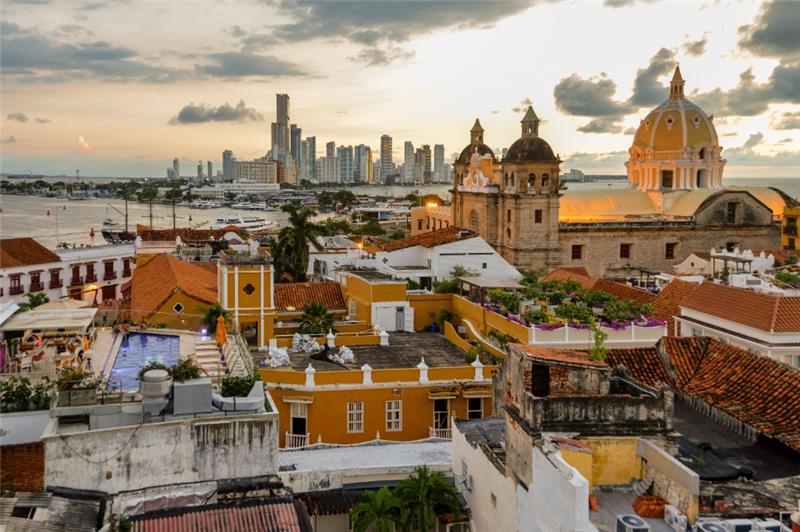
Colombia’s traffic challenges are most visible in Bogotá, where congestion has pushed the national Traffic Index to 198.0. Average commutes in the capital reach 46.7 minutes, with major points such as Avenida Caracas, Calle 80 and Autopista Norte frequently paralyzed by heavy traffic.
Even Medellín, despite operating the country’s only metro system, faces persistent delays as rapid urban growth overwhelms infrastructure.
The Inefficiency Index of 209.3 highlights the lost productivity caused by long commutes, while emissions at 5,067.0 underscore the environmental toll. Bogotá’s TransMilenio bus rapid transit system, once hailed as a model for Latin America, has struggled to keep up with surging demand, leaving commuters packed into overcrowded buses or stuck on congested roads.
India
- Traffic Index: 204.5
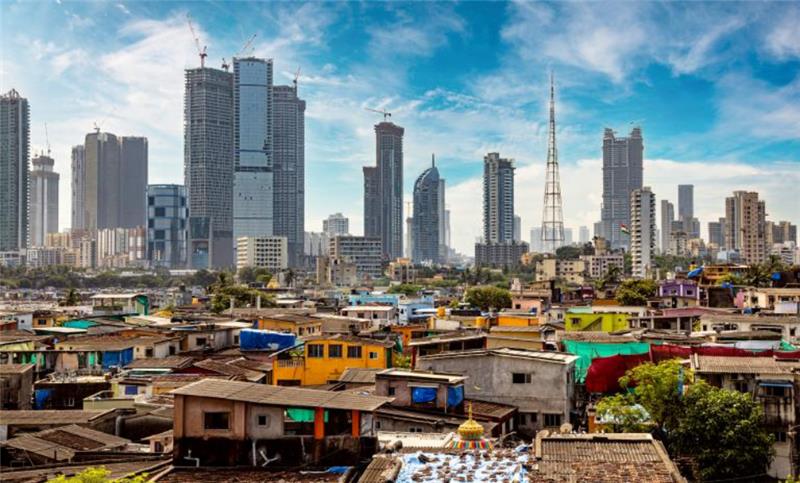
India’s traffic burden is spread across several megacities, pushing its Traffic Index to 204.5. In Mumbai, daily commuters face bottlenecks along the Western Express Highway and Eastern Freeway, stretching average travel times to 46.5 minutes.
Delhi grapples with chronic gridlock on the Ring Road and NH-48, compounded by high levels of vehicle emissions that intensify the city’s already dangerous air pollution.
Bengaluru, known as India’s “Silicon Valley,” has become a case study in urban gridlock. Congestion at Whitefield and the infamous Silk Board junction can turn routine trips into hours-long waits, straining both productivity and quality of life.
The CO₂ Emission Index of 6,014.9 illustrates the environmental costs of this urban traffic crisis, linking directly to India’s worsening air quality.
Iran
- Traffic Index: 212.2
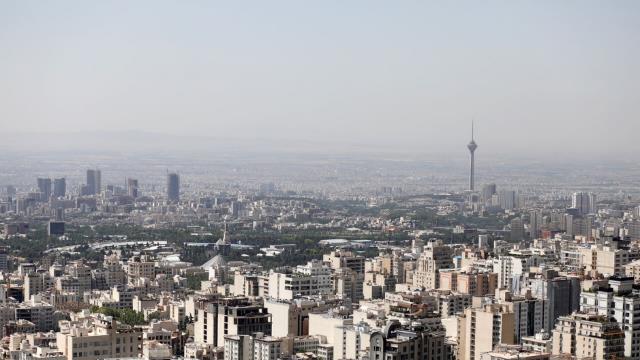
Iran’s traffic crisis is most acute in Tehran, where a Traffic Index of 212.2 highlights the scale of congestion in one of the Middle East’s busiest capitals. Average commutes stretch to 46.8 minutes, with key arteries such as Valiasr Street, Enghelab Square and Hemmat Expressway frequently gridlocked.
The problem is not simply inconvenience. The CO₂ Emission Index of 7,003.1 underscores the environmental toll, as traffic is a major contributor to Tehran’s chronic smog. Air quality worsens dramatically during winter inversions, when pollutants are trapped close to the ground, heightening health risks for millions of residents.
Peru
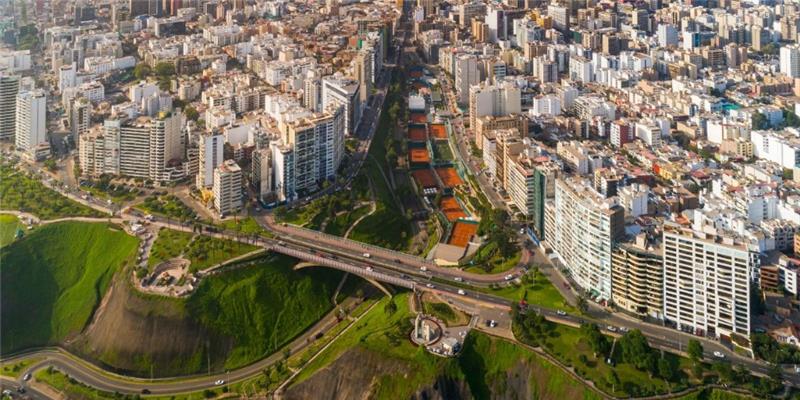
- Traffic Index: 225.1
Peru’s Traffic Index stands at 225.1, with Lima driving most of the congestion burden. Commutes in the capital average 49.8 minutes, often stretching longer along notorious choke points such as Javier Prado Avenue, Panamericana Sur, and the corridor linking the city to Callao port.
Informal and poorly regulated public transport systems, combined with rapid population growth, have intensified traffic delays. For many commuters, daily travel has become a drain on both time and productivity. The Time Exp. Index of 6,211.7, equal to nearly two hours of lost time, illustrates how gridlock eats into working hours and quality of life.
The strain isn’t limited to commuters. Emissions, measured at 6,425.8, reflect the environmental costs of congestion, undermining sustainability goals in a city already grappling with air quality challenges.
Egypt
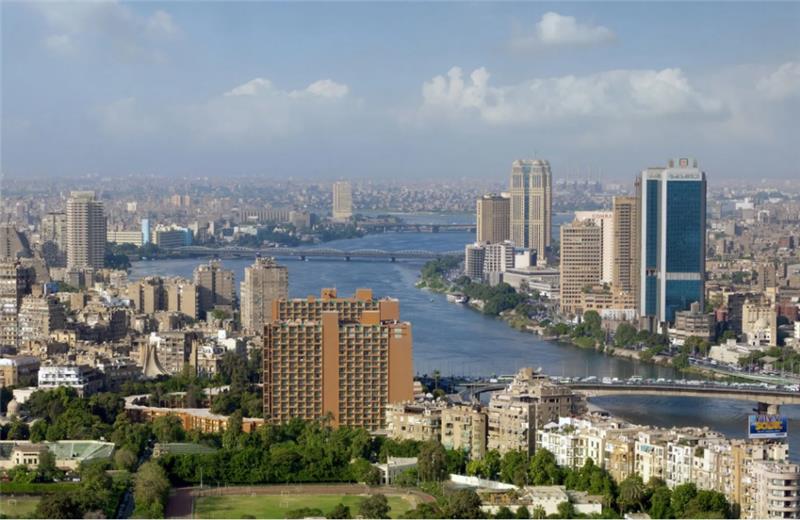
- Traffic Index:226.7
Egypt ranks sixth with a Traffic Index of 226.7 and 47.7 minutes on average per commute. Cairo is infamous for standstills on the Ring Road, 6th of October Bridge, and Ramses Square, worsened by weak enforcement of traffic rules and high vehicle density.
Alexandria also suffers from increasing congestion. The CO2 Emission Index of 8533.4 highlights Cairo’s worsening smog problem, making congestion both an economic and public health crisis.
Kenya
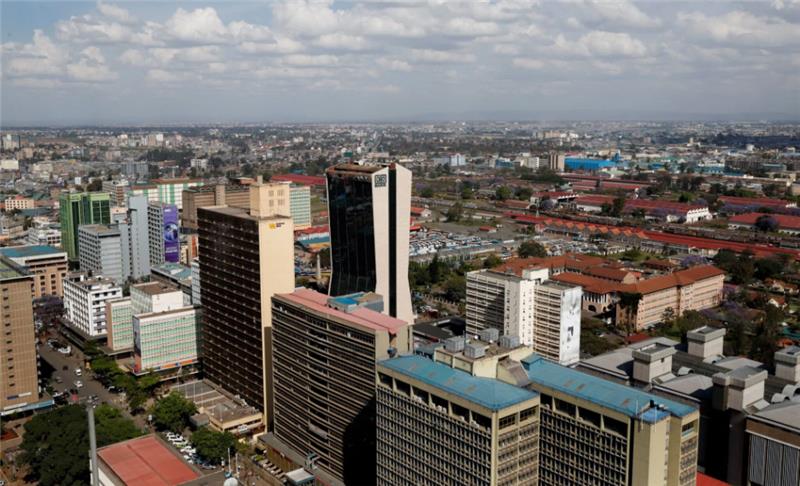
- Traffic Index: 240.1
Kenya records a Traffic Index of 240.1, with Nairobi bearing the brunt of the country’s congestion. Major routes such as Uhuru Highway, Thika Superhighway and Mombasa Road are frequent choke points. Commuters spend an average of 51.6 minutes per trip, with rush-hour traffic often turning journeys into hours-long ordeals.
The CO₂ Emission Index of 7,305.9 highlights how inefficient urban transport is undermining sustainability targets.
Bangladesh
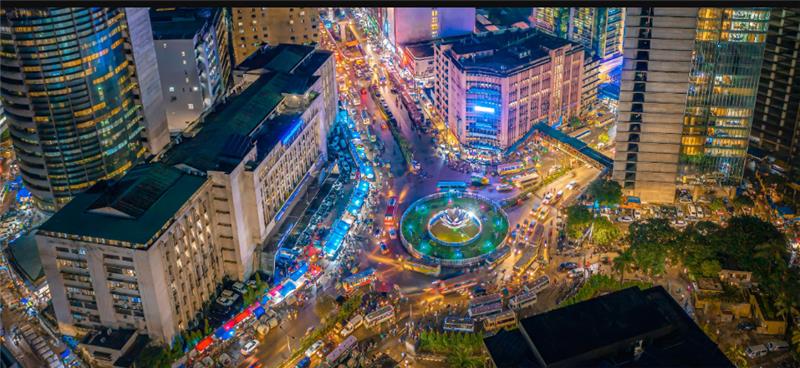
- Traffic Index: 253.2
Dhaka, often cited as one of the world’s most gridlocked cities, pushes Bangladesh’s Traffic Index to 253.2. Commutes of 56.5 minutes are common, with hotspots like Uttara, Farmgate, and Gulshan serving as choke points.
The Time Exp. Index is 11,901.5 seconds, that’s over three hours of extra time wasted in traffic compared to free-flowing roads. Overpopulation, poor road planning, and few alternatives to private vehicles fuel the crisis, while emissions of 4875.4 add to the city’s already alarming air pollution levels.
Sri Lanka
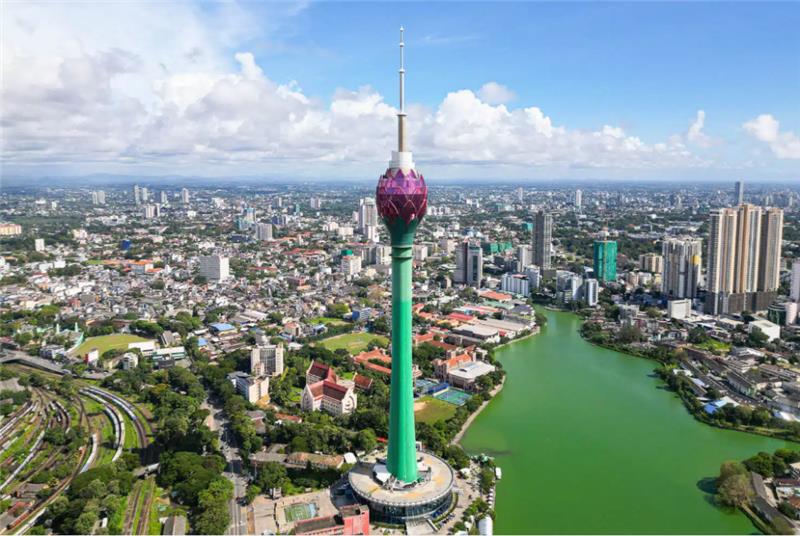
- Traffic Index: 256.8
Sri Lanka, with a Traffic Index of 256.8, faces some of the worst congestion in Colombo, where commutes average 54.2 minutes.
The stretch between Galle Road and Borella is particularly jammed, as are entry points from suburbs like Battaramulla and Maharagama. The Inefficiency Index of 356.3 reflects long delays, while the CO2 Index of 7229.9 highlights worsening pollution. Traffic in Colombo has become both a daily frustration and a drag on the island’s growing economy.
Costa Rica
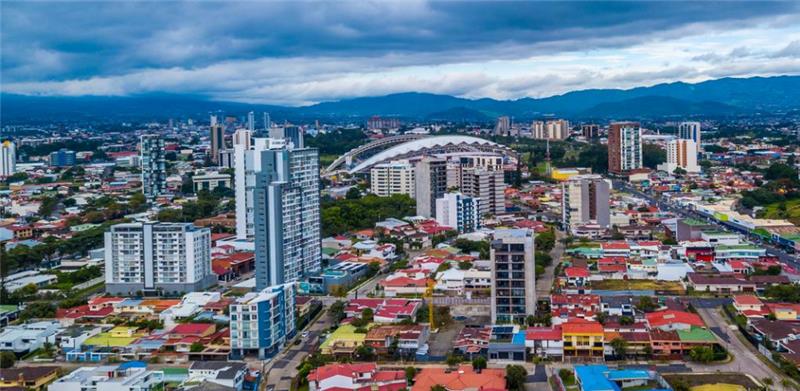
- Traffic Index: 301.0
Costa Rica, with a Traffic Index of 301.0, suffers chronic congestion, especially in San José, where drivers average 60 minutes per trip.
Narrow colonial-era roads and poor urban planning make areas like Circunvalación, Sabana, and Zapote notorious choke points.
The CO2 Index of 9516.5 shows how traffic undermines the country’s eco-friendly reputation, creating a contradiction for a nation globally praised for sustainability and renewable energy.
Nigeria
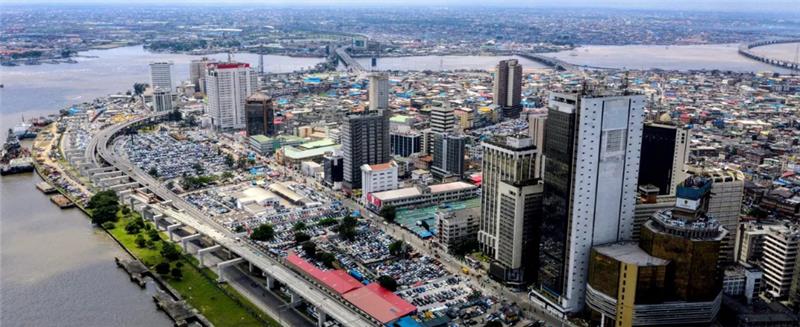
- Traffic index: 334.8
Nigeria tops the global traffic misery index with a Traffic Index of 334.8 and average commute times of 65.3 minutes. This means not only are commutes long, but they are highly unproductive due to poor road design, chaotic driving culture, and fuel consumption waste.
- Key Cities: Lagos (Third Mainland Bridge, Apapa Port access roads, Lekki-Epe corridor), Abuja (Airport Road, Nyanya-Maraba axis), Port Harcourt (East-West Road).
- Drivers of Traffic: Overpopulation in Lagos, limited road networks, poor public transport alternatives, and port congestion.
The country also records a high inefficiency index of 443.5, showing that delays and wasted fuel are major drivers of productivity loss.
 Follow Us on Google Discover

Gov. Sanwo should see where his inactions have put us. During Fashola tenure when there was the rule of law, it was much better. Now there’s a traffic economy. With beggars, traders, robbers, tauts, advertisers. Kiss goodbye to safe streets especially in Lagos.
Warning: Undefined variable $post_id in /var/www/nairametrics/wp-content/themes/nairametrics/comments.php on line 134
Warning: Undefined variable $post_id in /var/www/nairametrics/wp-content/themes/nairametrics/comments.php on line 134