
 Follow Us on Google Discover
Deprecated: mb_convert_encoding(): Handling HTML entities via mbstring is deprecated; use htmlspecialchars, htmlentities, or mb_encode_numericentity/mb_decode_numericentity instead in /var/www/nairametrics/wp-content/themes/nairametrics/functions.php on line 104
VOLUME PRICE ANALYSIS
NSEASI – Daily – 08/25/2016 –
High-27883.7
Low-27365.2
Open-27880.5
Close-27379.9
Volume= 215,339,008.000
Talking about a hard, hard fall. My mentor used to tell me that the bulls take the stairs and the bears jump off the windows… that was what we witnessed yesterday. The Bears took out in one day what the bulls built in 6 days.
Yes, the NSEASI took out a whopping 500 points off the market, Last time index dipped that low was June 24th and 27th (421 and 805 points).
The candlesticks are showing a bearish engulf formation which indicates a strong and sudden shift of investor sentiment from bullish to bearish. All momentum indicators also showed a sharp reversal of momentum to downside.
Other News
NSEASI Daily Chart
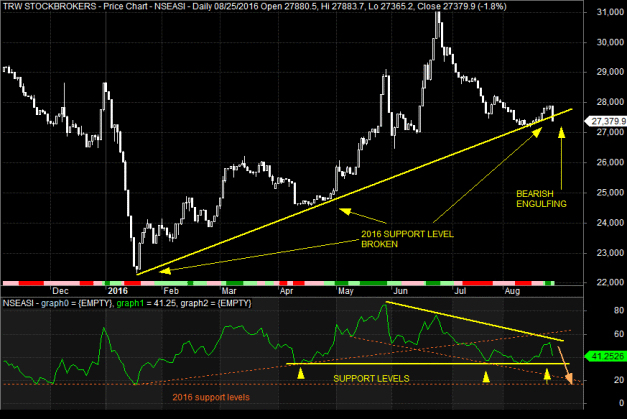
Traders need to be wary on:
The Index which has broken its 2016 support with a one day Bearish Engulfing candlestick
- RSI levels for April July and early August has acted as strong support levels (Lower indicator)
- RSI Levels on a longer time frame (Nov Dec 2015 and January 2016) has shown as last levels of support (dotted lines)
So, are we still safe? Yes, but we are certainly at the edge of the cliff once again as long as RSI support levels HOLD and prices returns back to its Upward support levels.
 Follow Us on Google Discover


Warning: Undefined variable $post_id in /var/www/nairametrics/wp-content/themes/nairametrics/comments.php on line 134
Warning: Undefined variable $post_id in /var/www/nairametrics/wp-content/themes/nairametrics/comments.php on line 134